
Micron: The Next TSMC?
Three shapes of the memory cycle, and a tail.

Ciao ragazzi,
I have been following the memory trade for a while but never acted on it. I believe that I have found an interesting entry point, and I have studied enough to get the necessary conviction. Happy to share with you my Micron investment thesis.
Thesis in one line:
Micron trades at ~7x forward earnings while printing 85% gross margins, because the market is pricing a classic memory bust. I think two things are changing: take-or-pay contracts and HBM are turning memory into a foundry-like business, and the AI buildout is only 25–50% done. The floor is higher and the test comes later than the market expects. If I’m right, the stock re-rates the way TSMC did. But this is not a buy-and-forget compounder or a bet with limited downside potential: there is a real chance this is a $400 stock and I intend to manage this position actively.
📖 Memory in 90 seconds
Every chip either computes (CPU, GPU) or remembers. Memory is the second kind.
DRAM = fast working memory next to the processor. NAND = slower storage inside SSDs (solid-state drives — the storage in your laptop and phone). DRAM is where the money is. This is a DRAM story.
HBM (High Bandwidth Memory) = 8–16 DRAM dies stacked vertically on the GPU package. AI workloads are memory-bound, not compute-bound: a GPU that can’t be fed data sits idle. HBM feeds it, sells for ~5–6x standard DRAM, and is sold out years in advance.
Only three companies make DRAM at scale: SK Hynix (HBM leader), Samsung (scale), Micron (the only US producer). China’s CXMT is closing in on commodity DRAM, a generation behind in HBM.
The one law of this industry: memory cycles die from supply overshoot, not weak demand. Booms tempt all three players to build fabs (chip factories) at once, the fabs land together 12–18 months later, prices collapse.
🤯 The numbers are crazy:
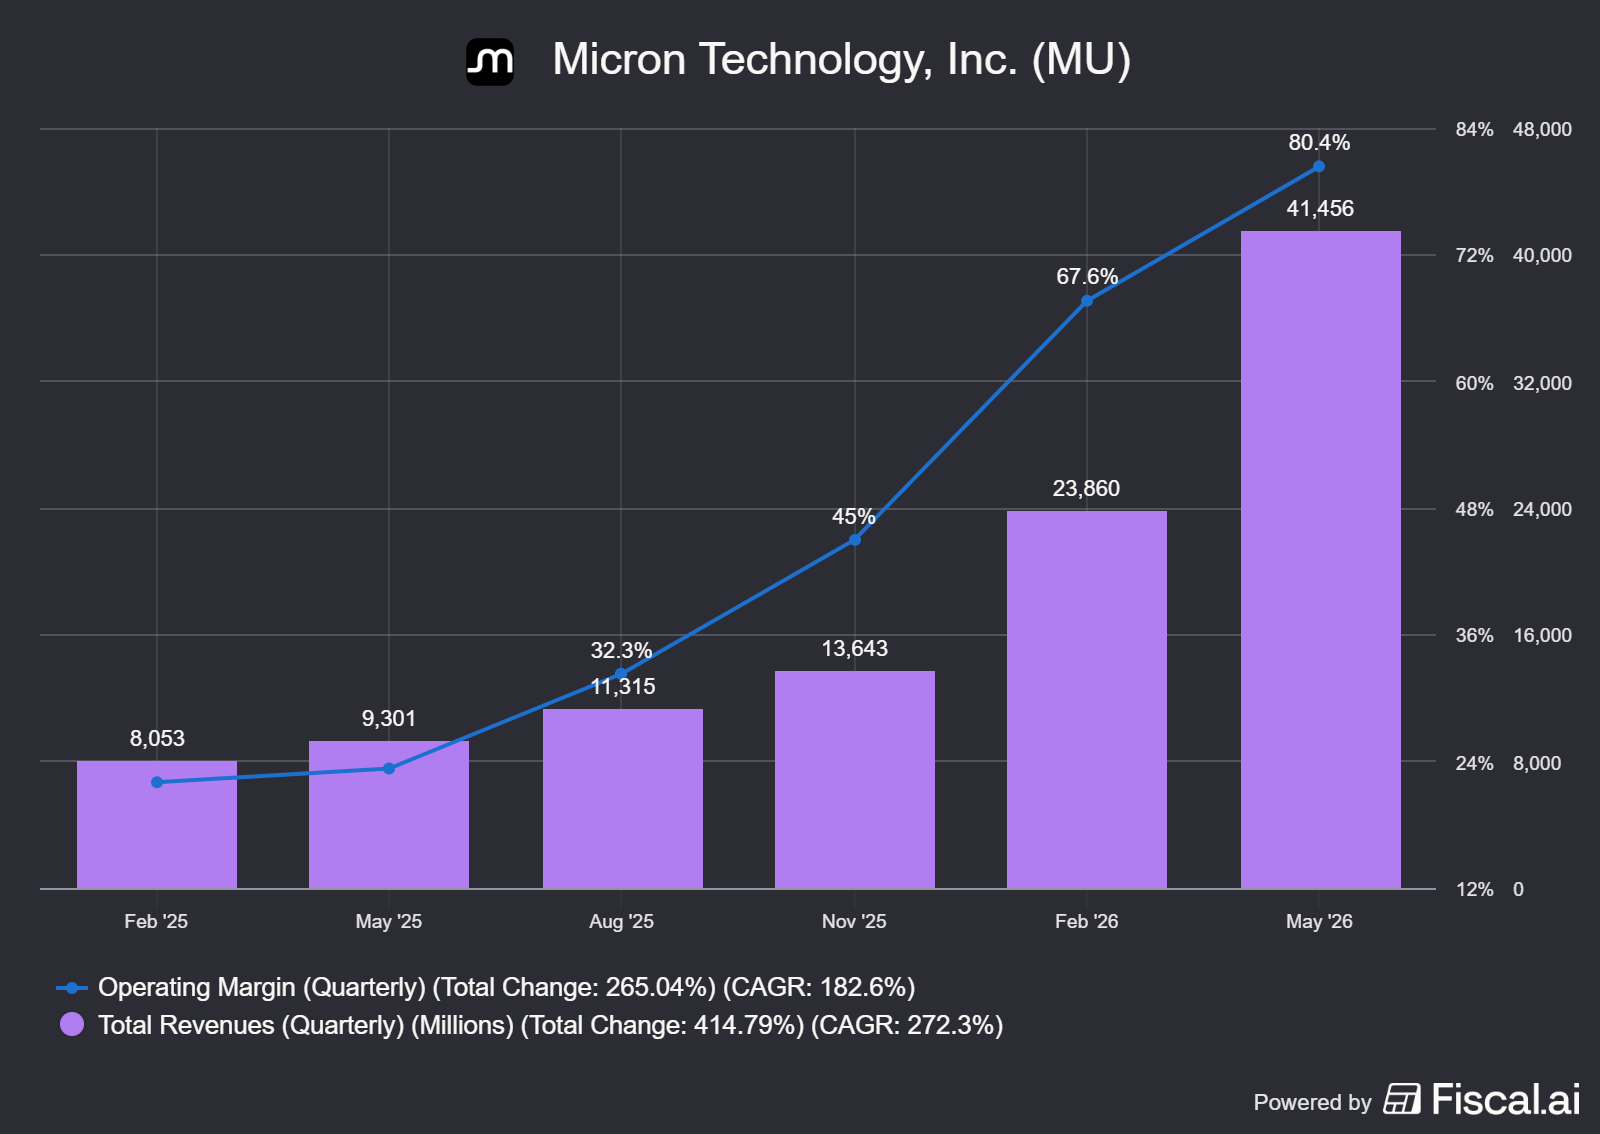
Revenue $41.5B, up 346% year over year
Gross margin ~85%, EPS $25.11
Free cash flow $18.3B in one quarter
$24B net cash on the balance sheet
Q4 guide: ~$50B revenue, ~86% GM, ~$31 EPS
One guided quarter now exceeds any full year in Micron’s history through fiscal 2024. Three months ago management guided this same quarter to $33.5B and beat their own forecast by $8B.
Is 85% gross margin the new normal? No. Nobody believes that, including management — the Q4 guide already embeds a “meaningful moderation in the rate of price increases.” This is a shortage super-spike. The investment question is what the business earns when the spike ends.
🪦 The bear story
Michael Burry is short from $1,051.87 (disclosed July 2). His story is simple:
Memory = the most brutal cyclical in tech
85% gross margin = the top of the cycle
Therefore → get out before the crash
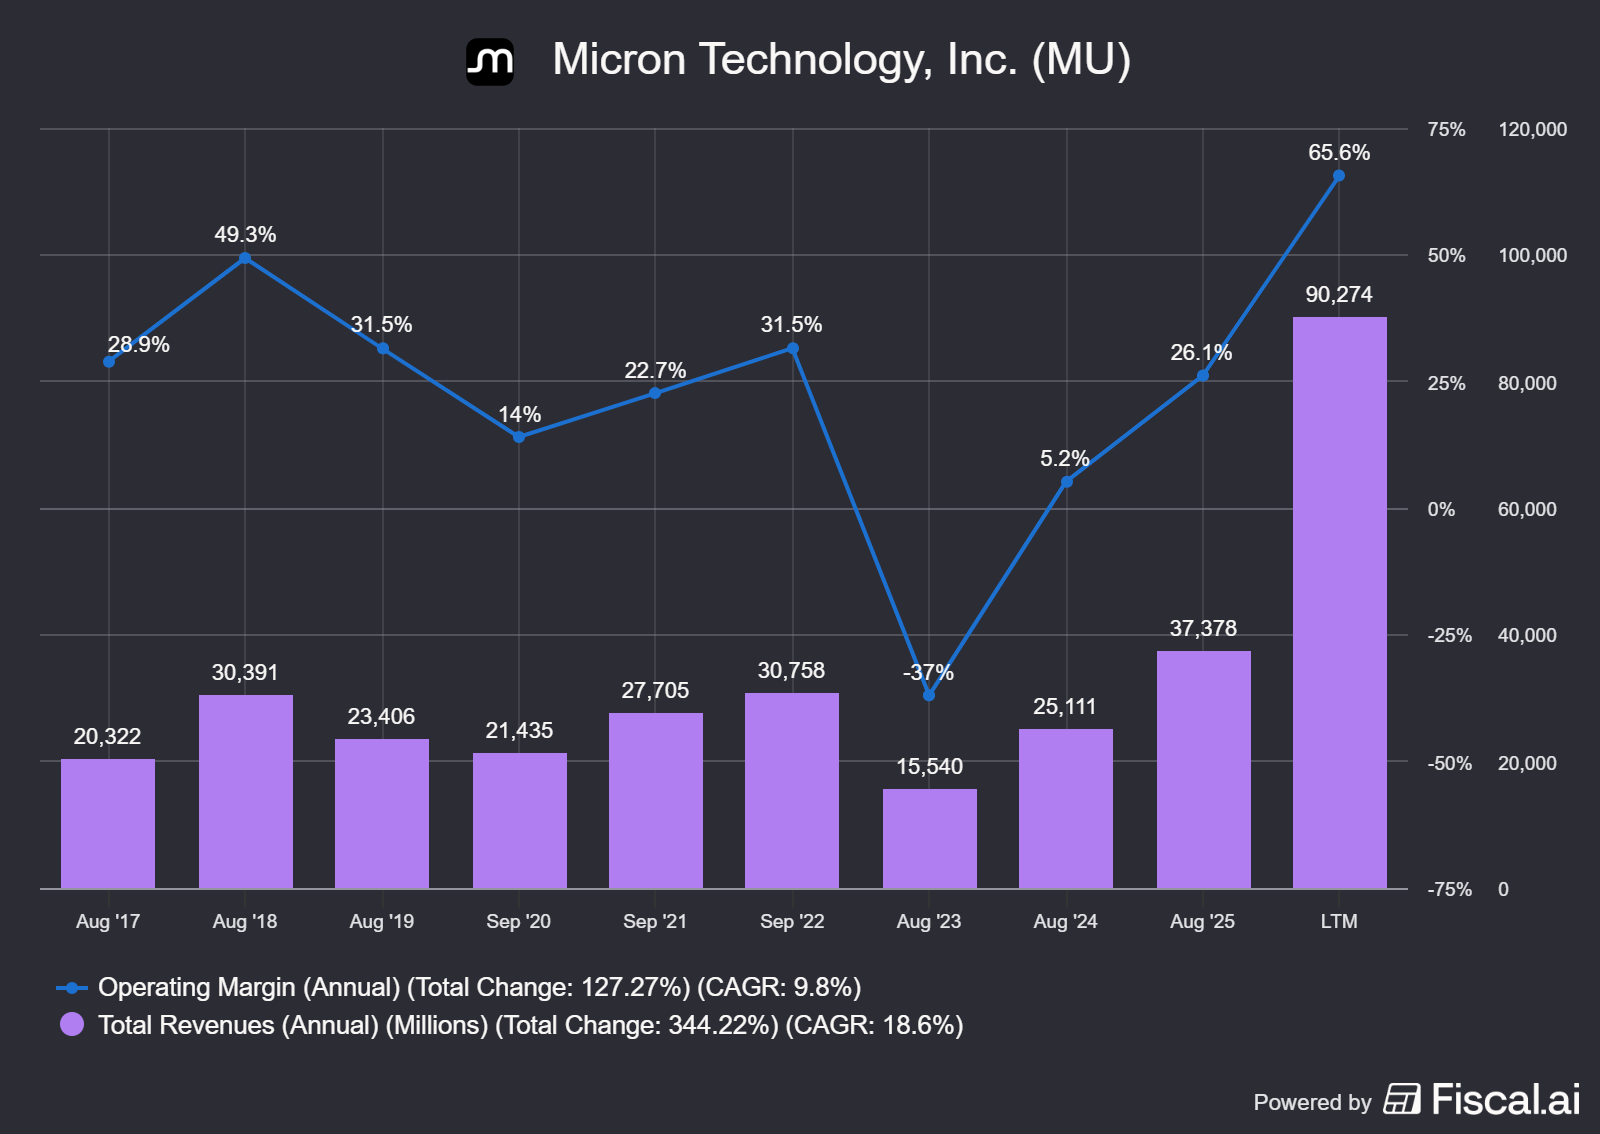
And on history, he’s right: 34 drawdowns of 30%+ over 42 years, median ROIC (return on invested capital) ~4%, negative free cash flow in nearly half of all quarters. His deeper point, that the hyperscalers — the giant cloud buyers: Microsoft, Google, Amazon, Meta — flatter their AI profits by depreciating short-lived GPUs over 5–6 years, is the most dangerous one. I’ll come back to it in the risks.
It’s not only Burry. Goldman Sachs’ Global Institute wrote in April that memory-price volatility is not “a permanent departure from historical cyclicality” and expects capacity expansion to normalize pricing over time. That is the institutional consensus in one sentence: a cycle, same as always. My argument is that the consensus is right about the cycle and wrong about its shape.
Anyone pitching Micron as “cheap at 7x” loses to Burry’s data. A low forward multiple at record earnings is what every memory top has looked like.
🌀 Three shapes, and a tail
The debate is not “cycle or no cycle.” It’s which shape the next cycle takes:
Shape 1 — the old cycle (Burry’s bet). AI capex air-pockets, supply normalizes, memory does what it always did. Revenue −45%+, gross margin to the low 20s, EPS ~$14.
Shape 2 — the old cycle with a floor. The downturn comes (~2028) but contracts and mix cushion it. Revenue −35%, gross margin troughs ~30% instead of below zero, EPS ~$30.
Shape 3 — the plateau. A digestion year, not a bust. Revenue −10–15%, gross margin ~50s, EPS ~$65–80. No memory cycle has ever looked like this. Something very close to it happened one industry over, though — next section.
Blue skies — the tail. Autonomous driving scales 2028–2030, humanoid robots 2030–2035, and the downturn shrinks to a wobble: revenue flat-to-up, margins in the 60s, EPS above $120.
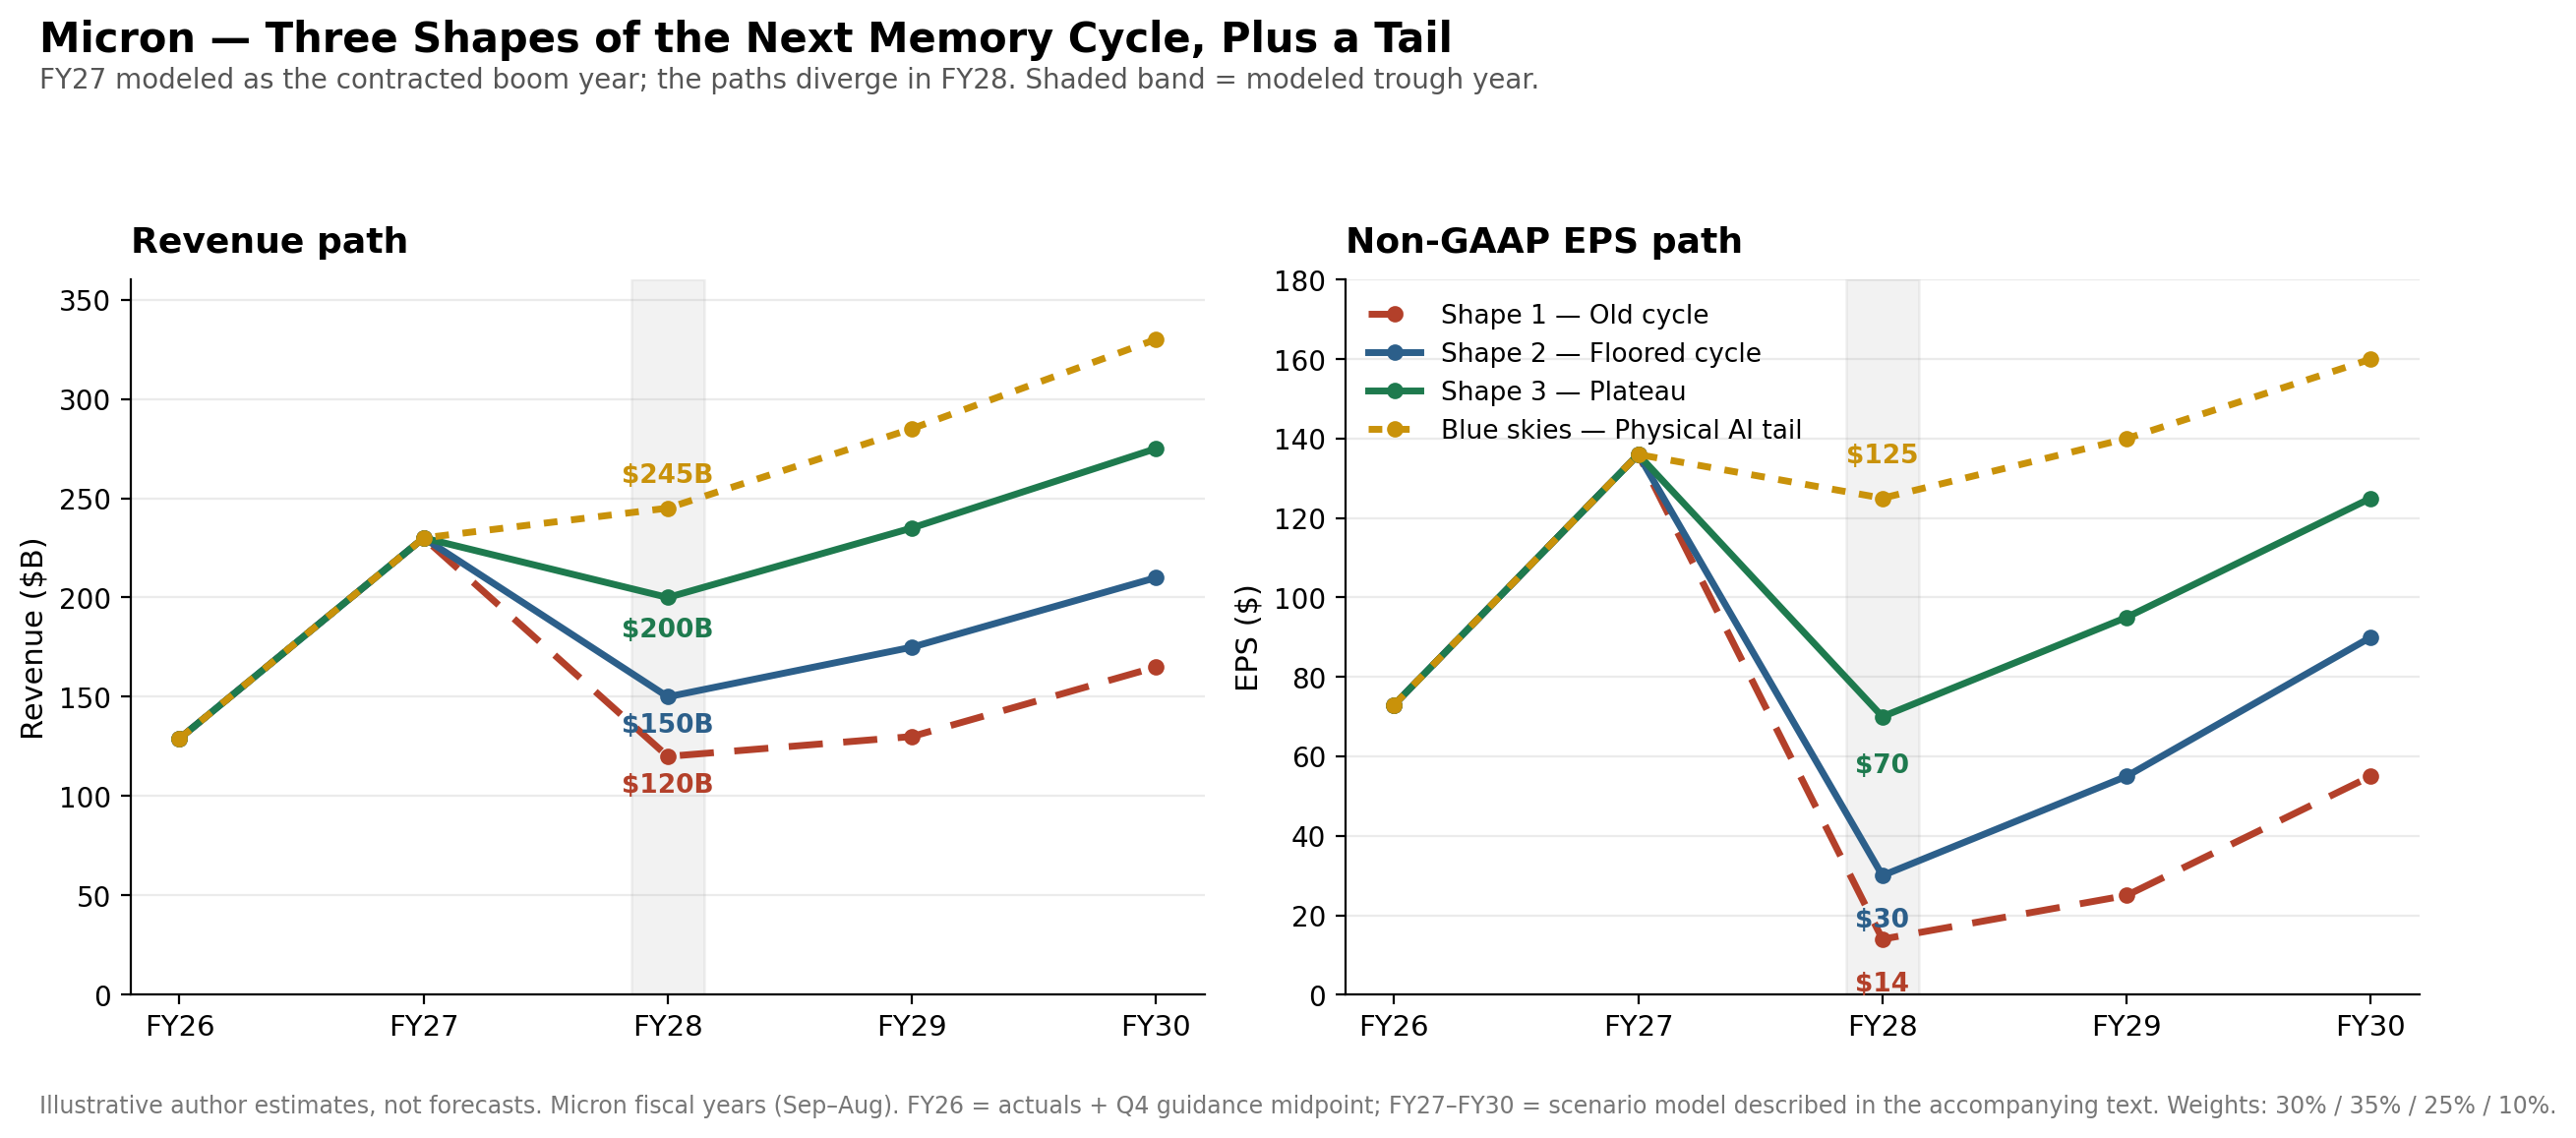
All paths share the contracted FY27 boom. The debate is FY28. Illustrative estimates, not forecasts.
Which shape we get comes down to two questions: is the floor real (structure and contracts — the TSMC section) and how much of the AI buildout is left (demand — my 25–50% view). I take them in turn, then put numbers on all four paths.
🏭 The TSMC precedent
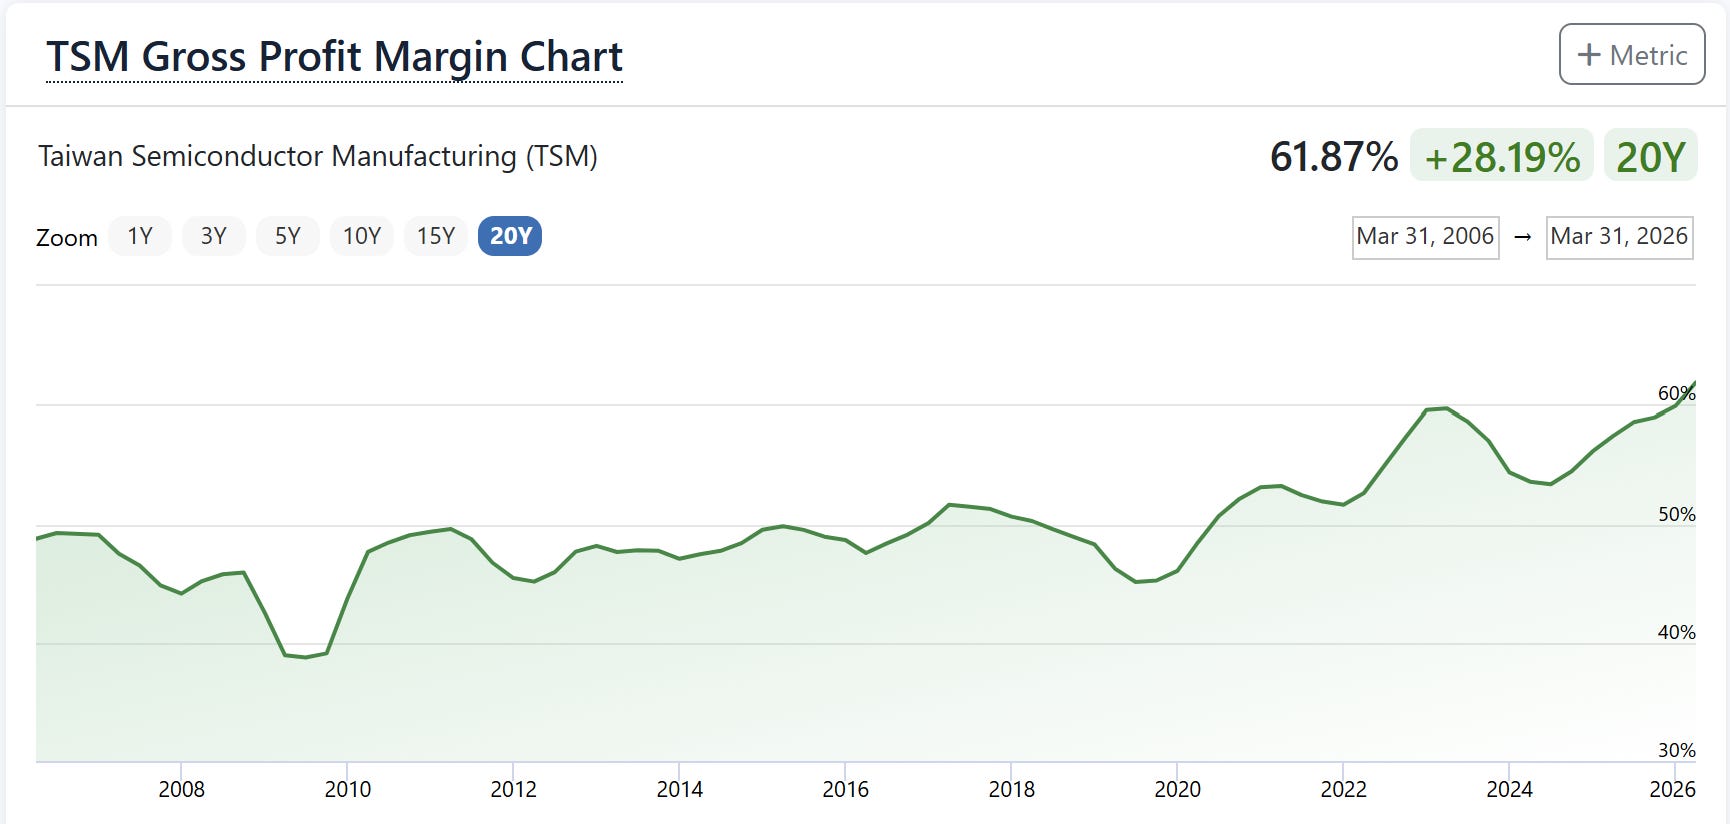
Foundry used to be memory’s twin: capital-intensive, boom-bust. In Q1 2009 TSMC’s gross margin collapsed to ~20%. Then the business changed shape:
2019 downturn: gross margin held ~46%
2023 downturn, the same one where Micron’s revenue halved and its gross margin went negative: TSMC’s revenue slipped only ~9% and gross margin held ~54%
The market re-rated TSMC from 10–16x to 20x+ only after downturns proved the floor. The re-rating lagged reality by years.
The objection a sharp reader will raise, so I’ll raise it myself: memory already consolidated to three players by 2013, and the cycle kept happening — 2016, 2019, 2023. “Consolidation brings discipline” has failed twice. But structure isn’t what saved foundry. Foundry escaped because its product stopped being fungible: a design win locks a customer in for years, so downturns hit volume gently instead of price violently. Memory kept cycling because a bit remained a bit.
So the real question: is memory’s product becoming sticky? The last 18 months rhyme hard with foundry’s transition:
HBM is semi-custom silicon. In a PC, memory is a stick you can swap. In an AI accelerator, the HBM stacks are bonded inside the same physical package as the GPU, wired together at the factory — the memory vendor is chosen at design time and physically unchangeable after (see the roadmap graphic further down: the grey squares around the GPU dies are the HBM stacks). And getting chosen means passing “qualification”: roughly a year of joint testing inside the customer’s own systems for performance, reliability, and heat. With HBM4, the base die (the chip at the bottom of each stack) is now custom-designed per customer. Switching vendors mid-platform means redoing all of it, so nobody does. Micron’s HBM4 revenue already crossed $1B.
The Strategic Customer Agreements (SCAs) are stronger contracts than TSMC ever had. 16 signed: take-or-pay (customers pay for minimum volumes whether or not they take delivery), five-year terms through 2030, price floors that management says produce gross margin “well above our peak quarterly margins in any past cycle.” ~$100B of contracted backlog at minimum volumes and prices. ~$22B of customer deposits, ~$18B in cash — customers pre-paying a memory supplier on non-cancelable contracts.
Customers are co-investing. In foundry, prepayments were the sign a vendor had become a partner. This is that sign, amplified.
The honest limits: only about half the business converts (the rest is fungible bits exposed to spot and CXMT), the floor is one year old and untested, and the SCA counterparties are all the same AI complex — a floor only as strong as customers who would crack together. This is memory’s TSMC moment, half complete. Not “Micron is TSMC now.”
🤖 How far into the AI buildout are we? My view: 25–50%
My scenario weights depend on this conviction: I believe we are between a quarter and half of the way through the AI buildout. It will be bigger and longer than people think.
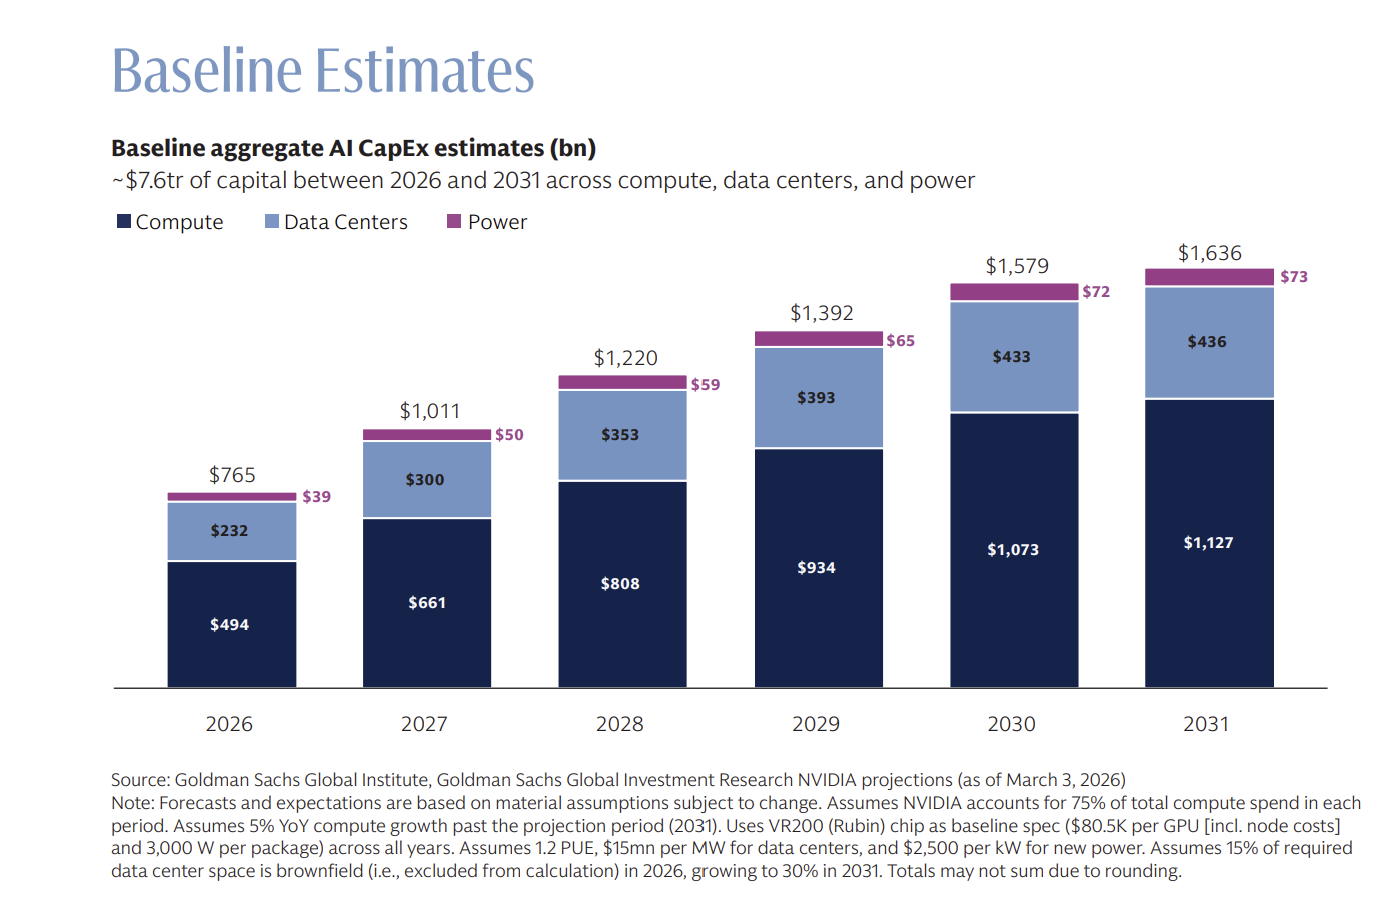
Capex is still accelerating: +40% into 2026, no hyperscaler guiding a plateau
Goldman Sachs’ Global Institute baseline models ~$7.6 trillion of total AI capex (chips + data centers + power) between 2026 and 2031, with annual spend still growing in 2031, from $765B to $1.64T. Even the cautious institutional base case has no peak inside the window
Demand rotates instead of exhausting: training → inference → agents, which burn tokens (and memory) at multiples of chat usage
The real bottlenecks are power, land, and fabs: multi-year constraints that stretch the spend instead of letting it burn out
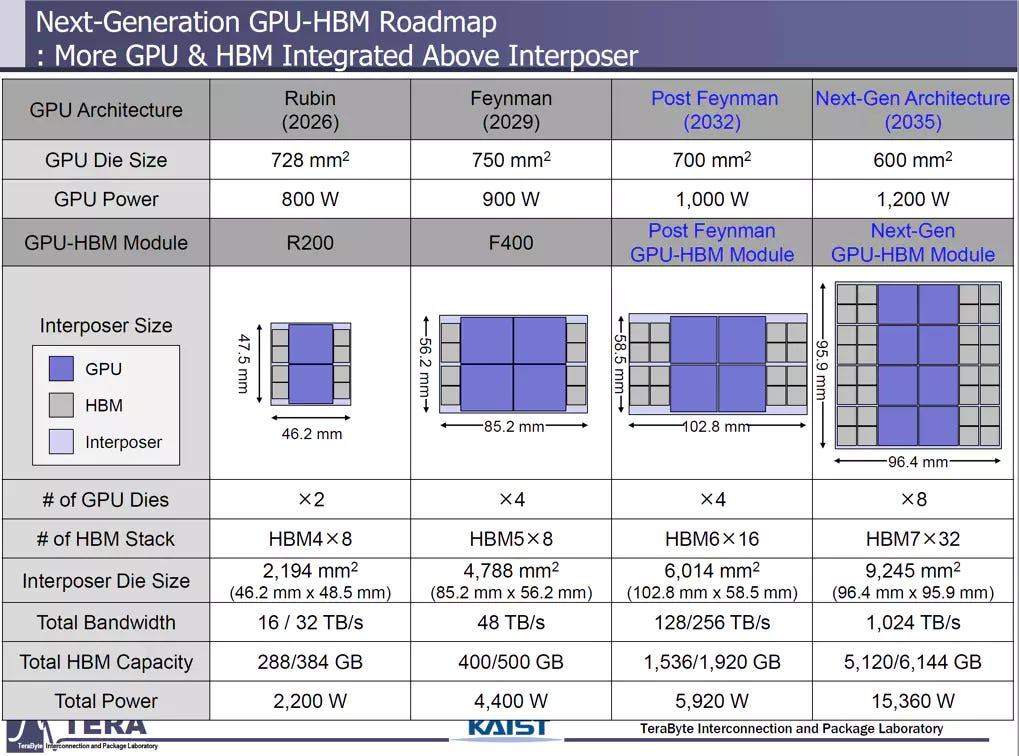
Source: KAIST TeraByte Interconnection and Package Laboratory.
This is a public academic roadmap. HBM stacks per GPU module go from 8 today to 16 in 2032 and 32 by 2035. Memory per module goes from ~300GB to ~6TB, roughly 20x in a decade. Power per module goes from 2.2kW to 15kW, which is why the buildout is gated by power and stretches over years. When I say we’re 25–50% done, this is what I mean: the hardware roadmap itself assumes another decade of compounding memory demand. And remember the 3x wafer math from the supply section: a world of 16- and 32-stack modules is also a supply-tightness roadmap. Notice the dates too: HBM6 (2032) and HBM7 (2035) land right in the window where the physical-AI tail would need them.
The honesty clause: “X% done” is impossible to prove. Nobody knows the denominator, and “the buildout is young” is what everyone believes at every capex peak in history. So the model below deliberately stress-tests a trough as early as FY28. If my view is right, the trough comes later and shallower, and the world resolves toward Shape 3. The falsifier is specific: the first sequential decline in hyperscaler capex guidance, or a forced GPU-depreciation reckoning. Either shows up, I reweight toward Shape 1 within a quarter.
🔢 The model
The one line that matters: $976 is almost exactly the Shape 2 price. The market has granted the floor — it is not pricing Burry’s collapse — but it pays nothing for the plateau and nothing for the tail.
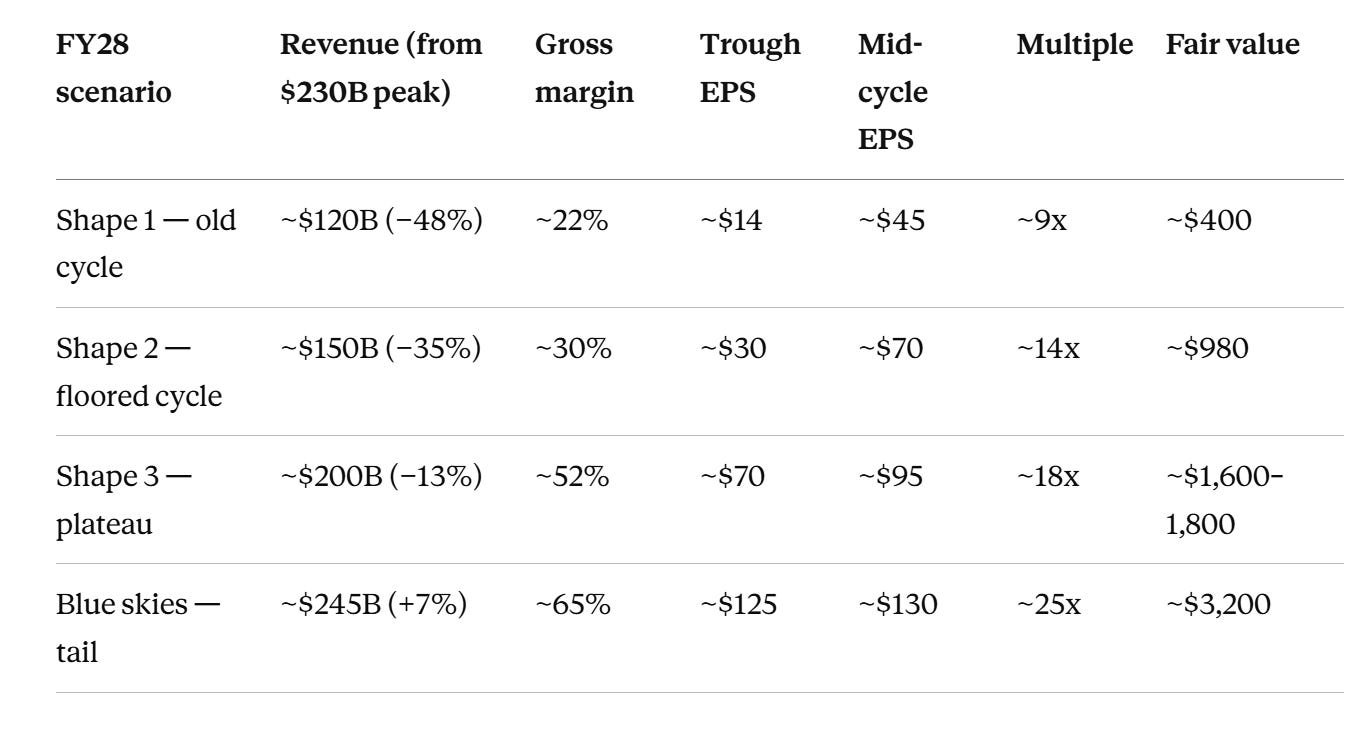
Fair value = mid-cycle EPS × multiple — I value a cyclical off normalized earnings, not off the peak or the trough. And notice the multiple itself climbs across the shapes: a proven floor doesn’t just lift EPS, it earns a higher multiple on that EPS. That double-count isn’t a modelling error — it’s precisely the TSMC re-rating (10–16x → 20x+), where the market pays more per dollar of earnings once it believes those earnings are durable. The bear case (Shape 1) is a ~9x cyclical; the plateau (Shape 3) is an ~18x structural grower; and the blue-skies tail, where a second datacenter wave removes any doubt about durability, is a ~25x compounder. Same company, wildly different animals depending on which shape proves out.
The one line that matters: $976 is almost exactly the Shape 2 price. The market has granted the floor — it is not pricing Burry’s collapse — but it pays nothing for the plateau and nothing for the tail.
Weighting the four shapes 30 / 35 / 25 / 10 gives a probability-weighted ~$1,210, about 24% above the price. All of the upside comes from the two scenarios the market prices at zero.
How I got there — the assumptions behind the numbers:
The FY27 boom is mostly volume, not price. The biggest SCAs cap their ceilings at today’s prices, so Micron traded away further spike upside to lock in the floor.
Trough gross margin, built two ways that agree. By segment mix: data center is now ~60% of revenue, and the FY23 disaster came from mobile/client at −23% GM — a mix that no longer dominates. By SCA coverage: ~50% of revenue floored at ~50% GM, ~50% spot at ~18%. Both land around 30% in the base case.
The soft spot, stated plainly: the 16 signed SCAs cover only ~25% of revenue today, and the ~$100B backlog is just ~$20B/year at floor prices. “Half or more of revenue” is management’s target, not today’s reality — and my model assumes that pipeline completes. If signings stall, Shape 2’s floor drops several points. Watch the SCA count every quarter; it’s the single most important input.
Honest footnote on physical AI:
On the tail’s 10%: the real kicker isn’t the memory inside the cars and robots — that’s small. It’s the datacenter capacity to train and run physical AI. World models (AI trained on video of the physical world) eat data at a completely different scale than text. Physical AI is the second datacenter wave. But it’s all future numbers, so I keep the probability low and fund it by shaving Shapes 2 and 3, never the bear.
The trade, in one line: I’m not buying a cheap stock. I’m buying a fairly-priced Shape 2 business with a free option on Shape 3 and an unpriced lottery ticket on physical AI — and the TSMC precedent says the market concedes that re-rating late, with a multiple expansion on top of the earnings.
⚠️ What kills the thesis
AI-capex digestion. Burry’s depreciation critique: GPUs depreciated over 5–6 years against a 2–3 year real life, flattering hyperscaler AI profits, so today’s $600B+ capex rests partly on accounting that eventually corrects. It’s the one argument that collapses Shape 3 and strains Shape 2, because SCA floors are only as good as counterparties who fail together. This is the real bear case; the memory cycle is just how it gets delivered. One datapoint on the other side: trailing-edge GPUs (A100s, H100s) still rent at prices implying 5–6+ year useful lives (GS Global Institute, April 2026), though that may just reflect today’s scarcity.
CXMT. Chinese trailing-edge DRAM attacks the half of revenue the SCAs don’t protect. Chinese trailing-edge foundries never dented TSMC, but that’s because TSMC’s profits sat at the leading edge. Micron’s commodity half is more exposed.
Unproven floors. Management’s floor-margin claim is a characterization, not a downturn-tested fact, and they pointedly declined to discuss 2027 HBM pricing. TSMC re-rated only after downturns proved its floor. Micron’s proof arrives through the first downturn, not before it.
🔭 What I’m watching (instead of the P/E)
The 2027 HBM contract-price settlement — management’s silence here is the most important open question; a strong settlement is direct evidence the floor regime is real
Hyperscaler calendar-2027 capex guidance this fall — the first digestion signal, if it comes
CXMT bit-supply and pricing data — the threat to the unprotected half
SCA backlog and customer deposits every quarter — the regime compounds or stalls, visibly, every ninety days
For the tail: robotaxi fleet economics and the first credible humanoid volume commitments — evidence there, and the 10% migrates into the base case
📌 Final take and investment decision
I opened at ~$1,020 and added in the $940s on the Burry pullback, average ~$1,000. A modest add, not back-up-the-truck: at these prices you pay full Shape 2 value, and the return depends on Shape 3 evidence showing up. Above ~$1,500-$1,600, where Shape 3 becomes consensus, I may trim or close the position. I size for a 30–40% drawdown I won’t be forced to sell (the stock already did one this March). There is a real chance — I put it at 30% — that MU is a $400 stock. I hold it anyway.
Bottom line: every prior memory cycle broke on two facts. Supply could respond fast, and the product was a perfect commodity. The first is suspended until at least 2028 by construction schedules. The second is being dismantled in real time by HBM’s design-win economics and $100B of take-or-pay contracts. So — is Micron the next TSMC? Honest answer: half of it is trying to become that, and nobody can prove it until the first downturn. Which is exactly why it’s not in the price. The market has priced the cushion. It has not priced the transformation at all. This is where alpha may reside.
Sources & data notes
Micron Q3 FY2026 prepared remarks & earnings deck — Micron, 6/24/26. Q3 results: rev $41.5B, GM ~85%, EPS $25.11, FCF $18.3B, net cash $24.4B; Q4 guide; SCA margin claim; HBM4 revenue >$1B.
Micron Q3 FY2026 earnings call transcript — Micron, 6/24/26. SCA detail: 16 deals, 5-yr terms to 2030, ~20% DRAM / ~1/3 NAND covered, ~$100B RPO, $22B deposits (~$18B cash).
Micron FY2025 Form 10-K — SEC EDGAR, 10/25. Segment revenue/margin history, incl. FY23 trough (mobile/client −23% GM).
Micron Q1–Q2 FY2026 earnings materials — Micron, 12/25 & 3/26. Segment margin trajectory; buyback restriction lifting Dec 2026.
“Tracking Trillions” — Goldman Sachs Global Institute, 4/26. ~$7.6T AI capex baseline 2026–31; GPU useful-life sensitivity; trailing-edge rental data; memory-normalization consensus view.
DRAM / HBM supply and pricing outlook — TrendForce, 6/26. HBM wafer-start share ~18/22/30% (25/26/27); HBM4 2027 pricing; DDR5 vs. HBM per-wafer revenue; 2027 TAM forecast >$1.28T.
Memory bit-supply forecast — IDC, 6/26. 2026 bit-supply growth: DRAM ~16%, NAND ~17%, vs. 20–30% historical.
Memory market intelligence — MemoryXRef, 7/26. Top-8 hyperscaler capex >$600B (+40%); fab timelines.
“Memory’s $200B Inflection” — Creative Strategies, 2/26. ~3x HBM wafer trade ratio; cycle-peak preconditions (none met).
Michael Burry short disclosure — Substack, 7/2/26. Short at $1,051.87; 34 drawdowns >30%/42yrs; ROIC ~4%; depreciation critique.
Coverage of the Burry short — 24/7 Wall St., The Motley Fool, TheStreet, 7/26. Corroboration; companion shorts (NVDA, AMAT, SOXX).
Price and valuation context — Simply Wall St, GuruFocus, 7/26. MU ~$976; consensus target ~$1,486; GF Value ~$489.
TSMC annual/quarterly reports — TSMC IR, 2009–2024. Q1’09 GM ~20%; FY19 ~46%; FY23 rev −8.7% w/ GM ~54%; customer prepayments.
GPU-HBM integration roadmap — KAIST TERA Lab, N/A. Roadmap graphic: HBM stacks 8→32, capacity ~300GB→~6TB, power 2.2kW→15kW, 2026–35.
All forward figures (FY27 revenue, trough margins, EPS paths, weights, fair values) are my estimates, not sourced forecasts.
And that's it! Please let me know if you liked it, what I can improve, and if you think this newsletter could help a friend, please send it to them!#
Federico
Please remember that everything written in this newsletter/website is for educational purposes only and should not be interpreted as financial, legal, or tax advice. The opinions, analyses, information, or recommendations expressed here are solely my own. Remember that financial decisions involve risks and should be made based on your own personal circumstances and after consulting a qualified professional.